3.6 mm: lightest passing tested design
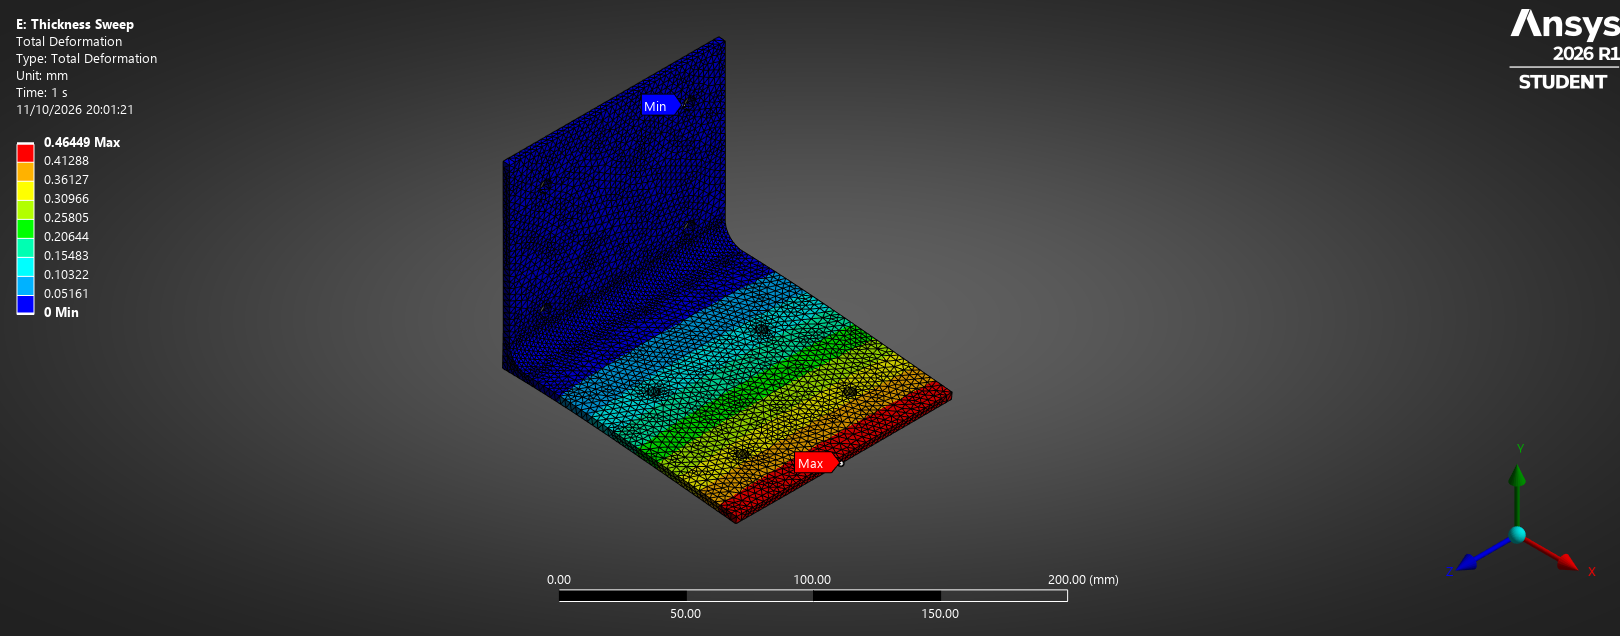
268.60 g, refined deflection 0.46449 mm. A 9.61% mass reduction relative to the 4 mm R10 model, with roughly 7.1% clearance to the specified displacement limit.
MECHANICAL DESIGN / STRUCTURAL FEA / OPTIMISATION · INDEPENDENT PROJECT
Designed an aluminium motor mounting bracket in SolidWorks, compared four bend-radius geometries in ANSYS Mechanical, then parameterised thickness in DesignModeler. A 15-point sweep and mesh-refinement study identified a lightweight design that meets a project-defined static deflection target.
01 / DESIGN OBJECTIVE
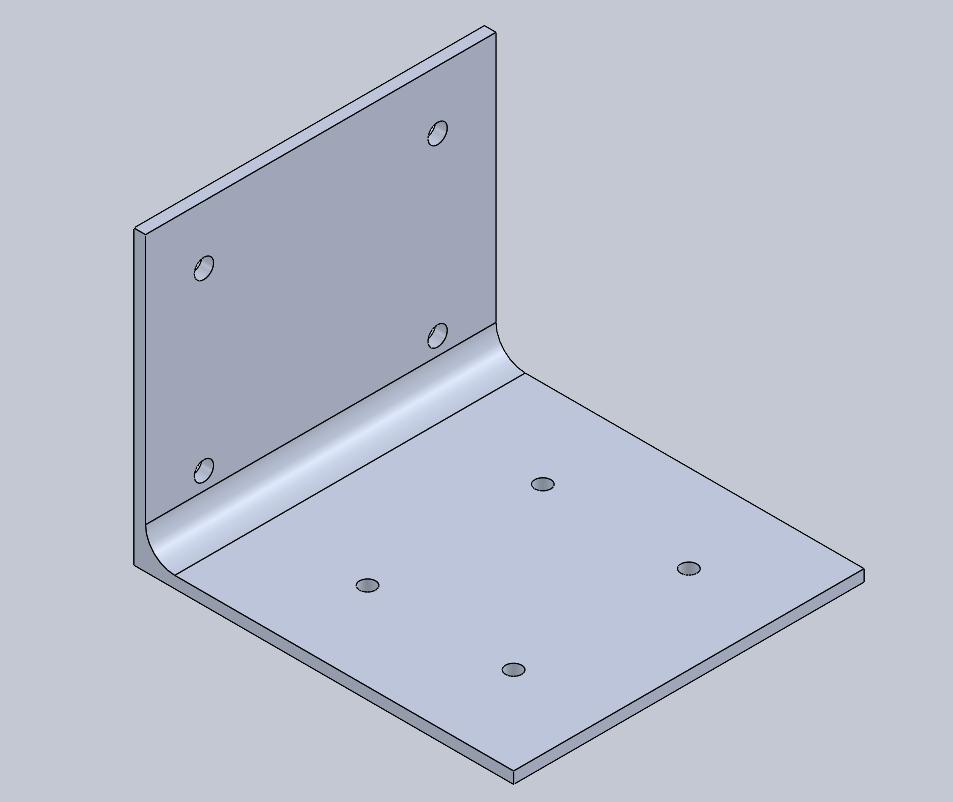
The task was to reduce mass under a simplified downward motor load while keeping maximum total displacement below 0.50 mm. The first iteration used a 4 mm aluminium L-bracket; geometry changes examined how the inside bend radius affected stress distribution and deformation before thickness optimisation.
Create the initial motor and wall-mounting geometry.
Check R0, R2, R5 and R10 fillet variants in static FEA.
Parameterise plate thickness and calculate mass, deflection and peak stress.
Refine the candidate mesh and inspect support and load definitions.
Scope: This is a numerical design study, not a manufactured or experimentally validated bracket. The 0.5 mm threshold is a project-specific engineering criterion rather than an industry-certified requirement.
02 / GEOMETRY DEVELOPMENT
Four internal-corner variants were developed. The R10 model was used for the subsequent thickness sweep; the selected fillet provides a smoother load path around the bend, but geometry performance depends on consistent mounting and loading assumptions.
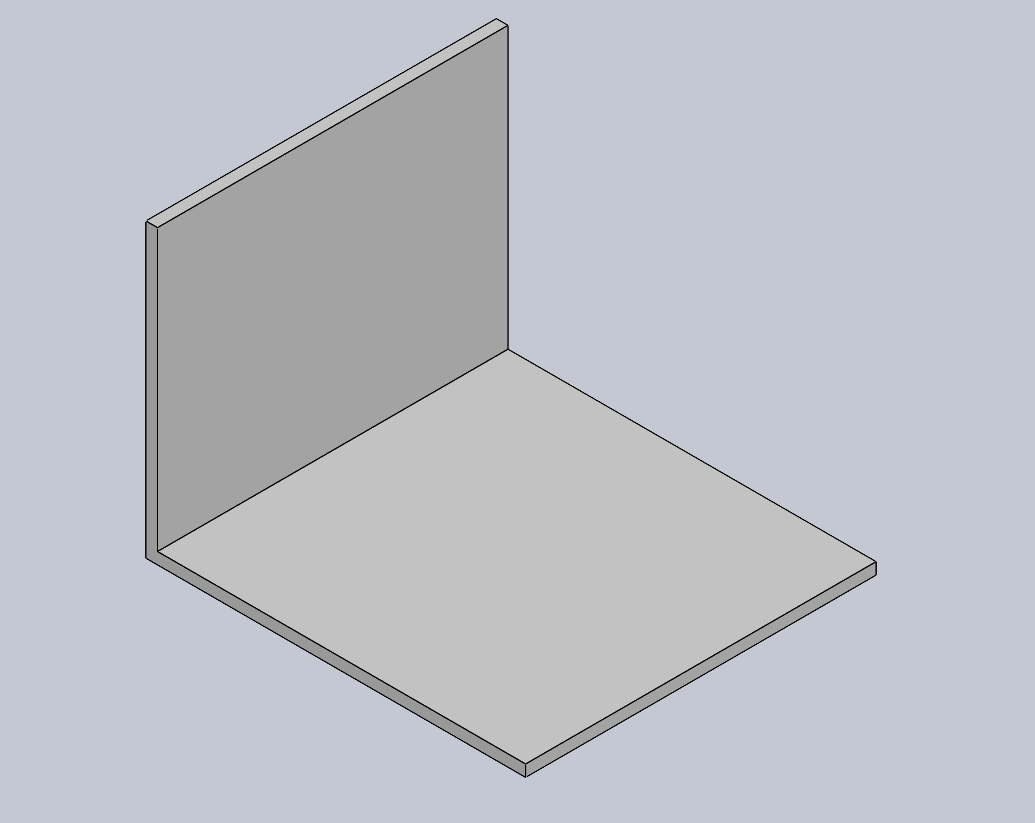
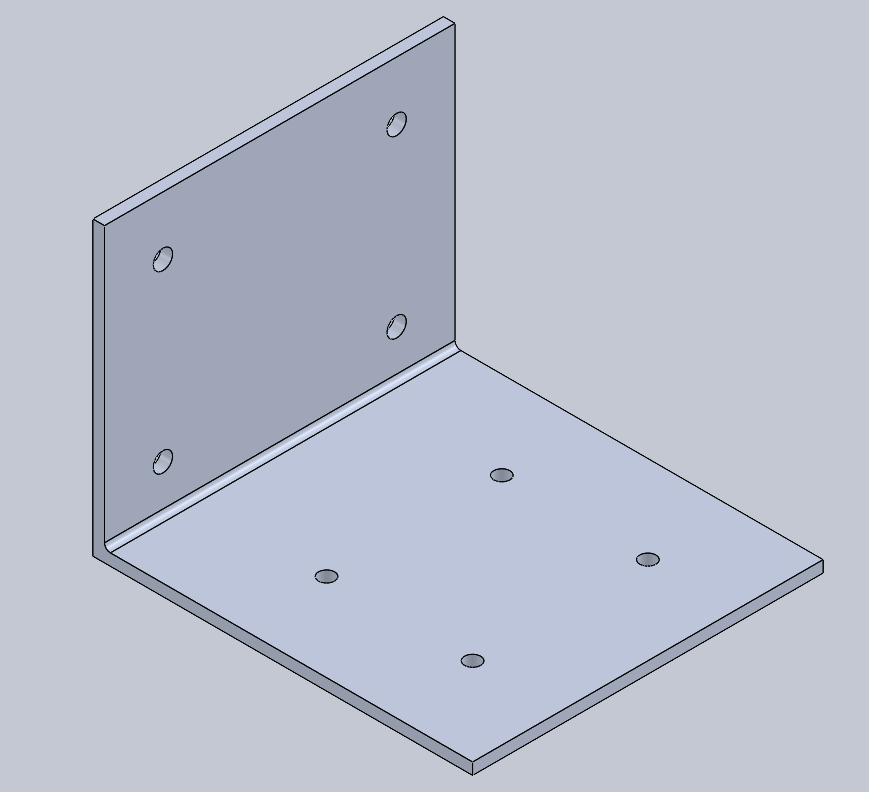
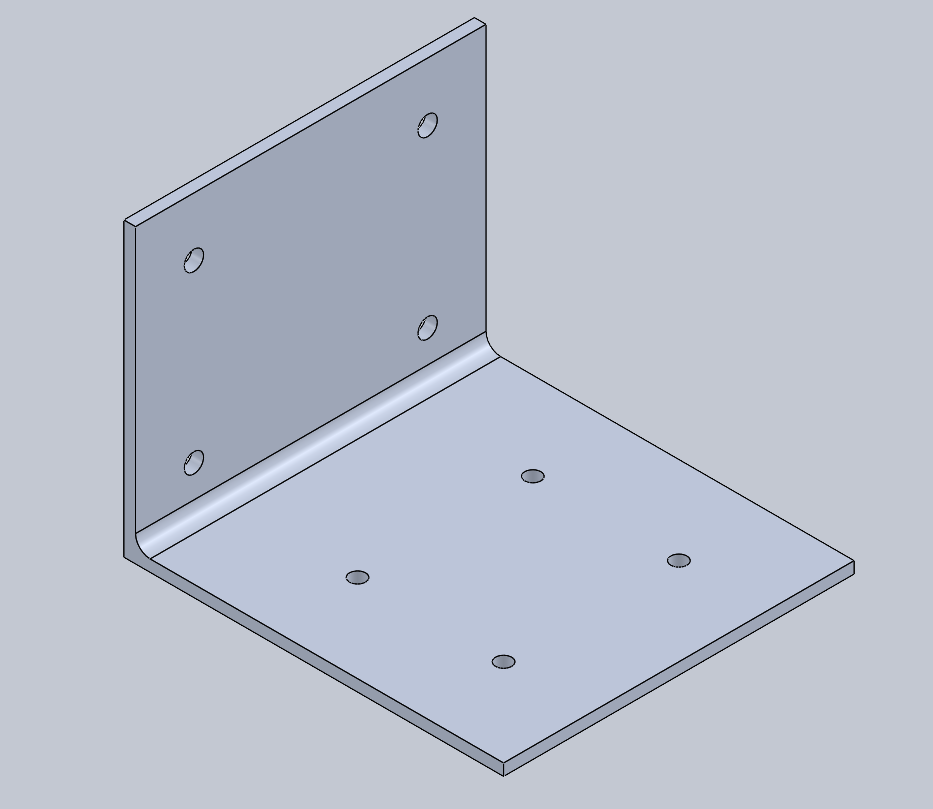
The parameterised R10 model retained the mounting geometry while varying the plate thickness. The nominal bracket envelope was approximately 130 × 120 × 100 mm.
03 / FEA MODEL
The model uses isotropic Aluminium 6061-T6 with Young's modulus 69 GPa and nominal tensile yield strength 275 MPa. Four wall-hole cylindrical faces are constrained; a 40 N downward force is distributed to the four motor-mounting hole faces through a deformable remote-force definition at global coordinates (80, 2, 60) mm.
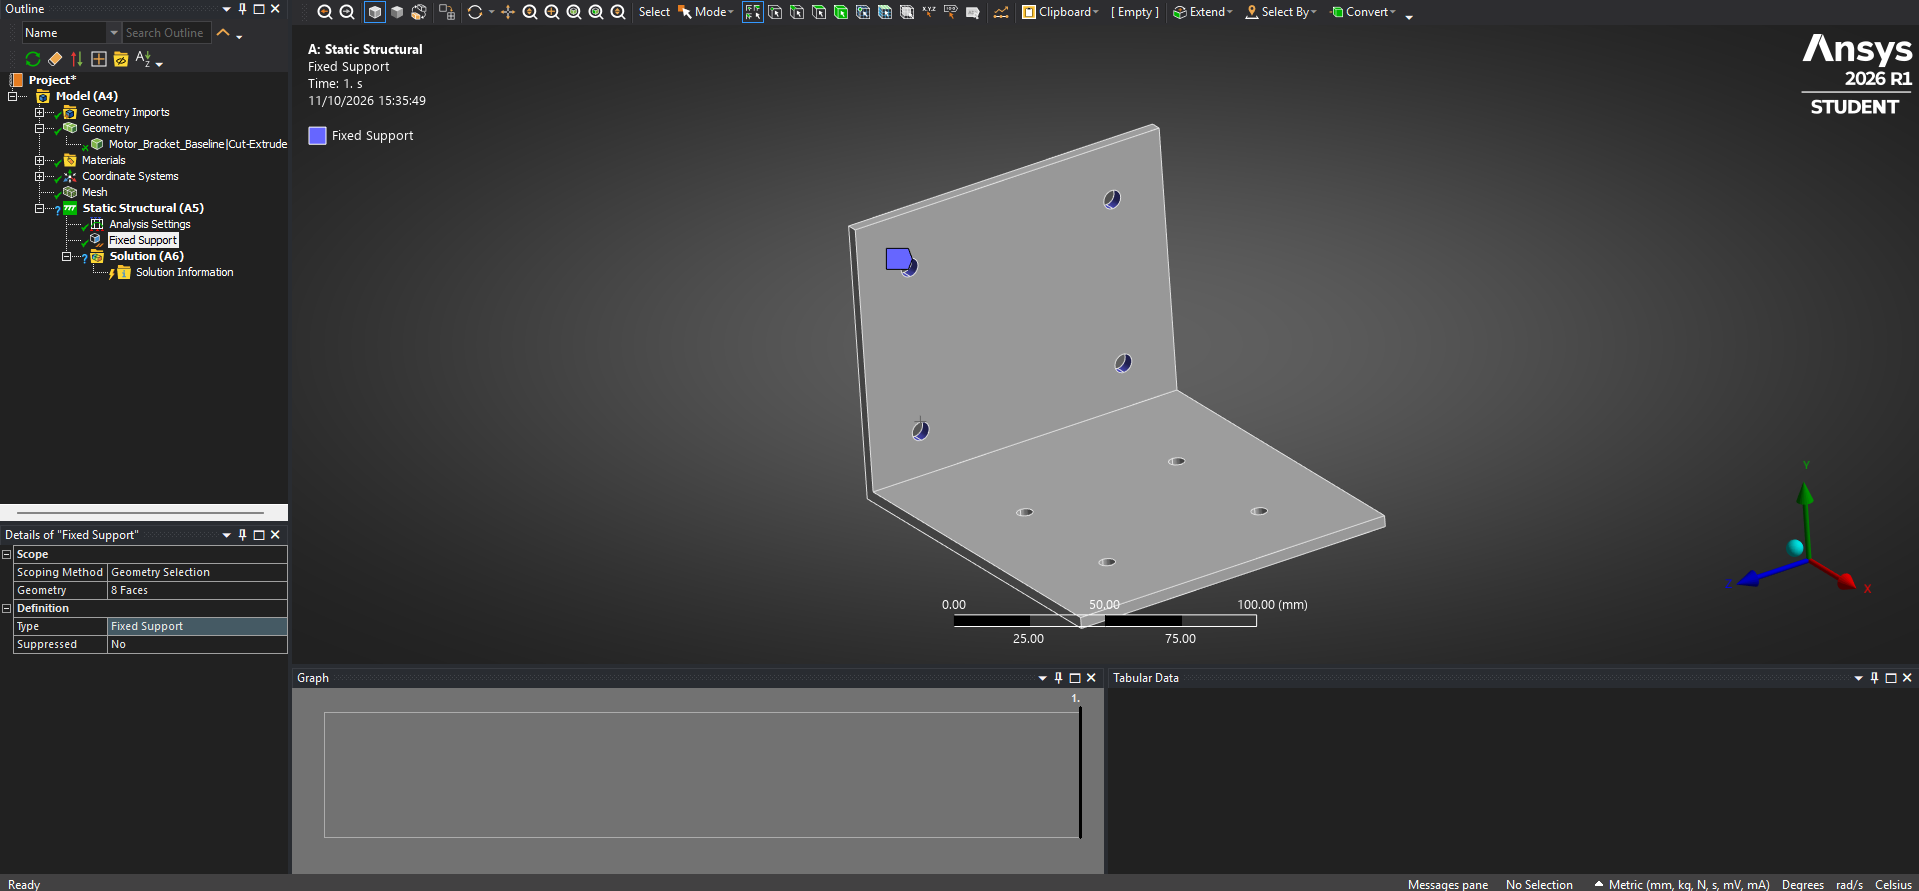
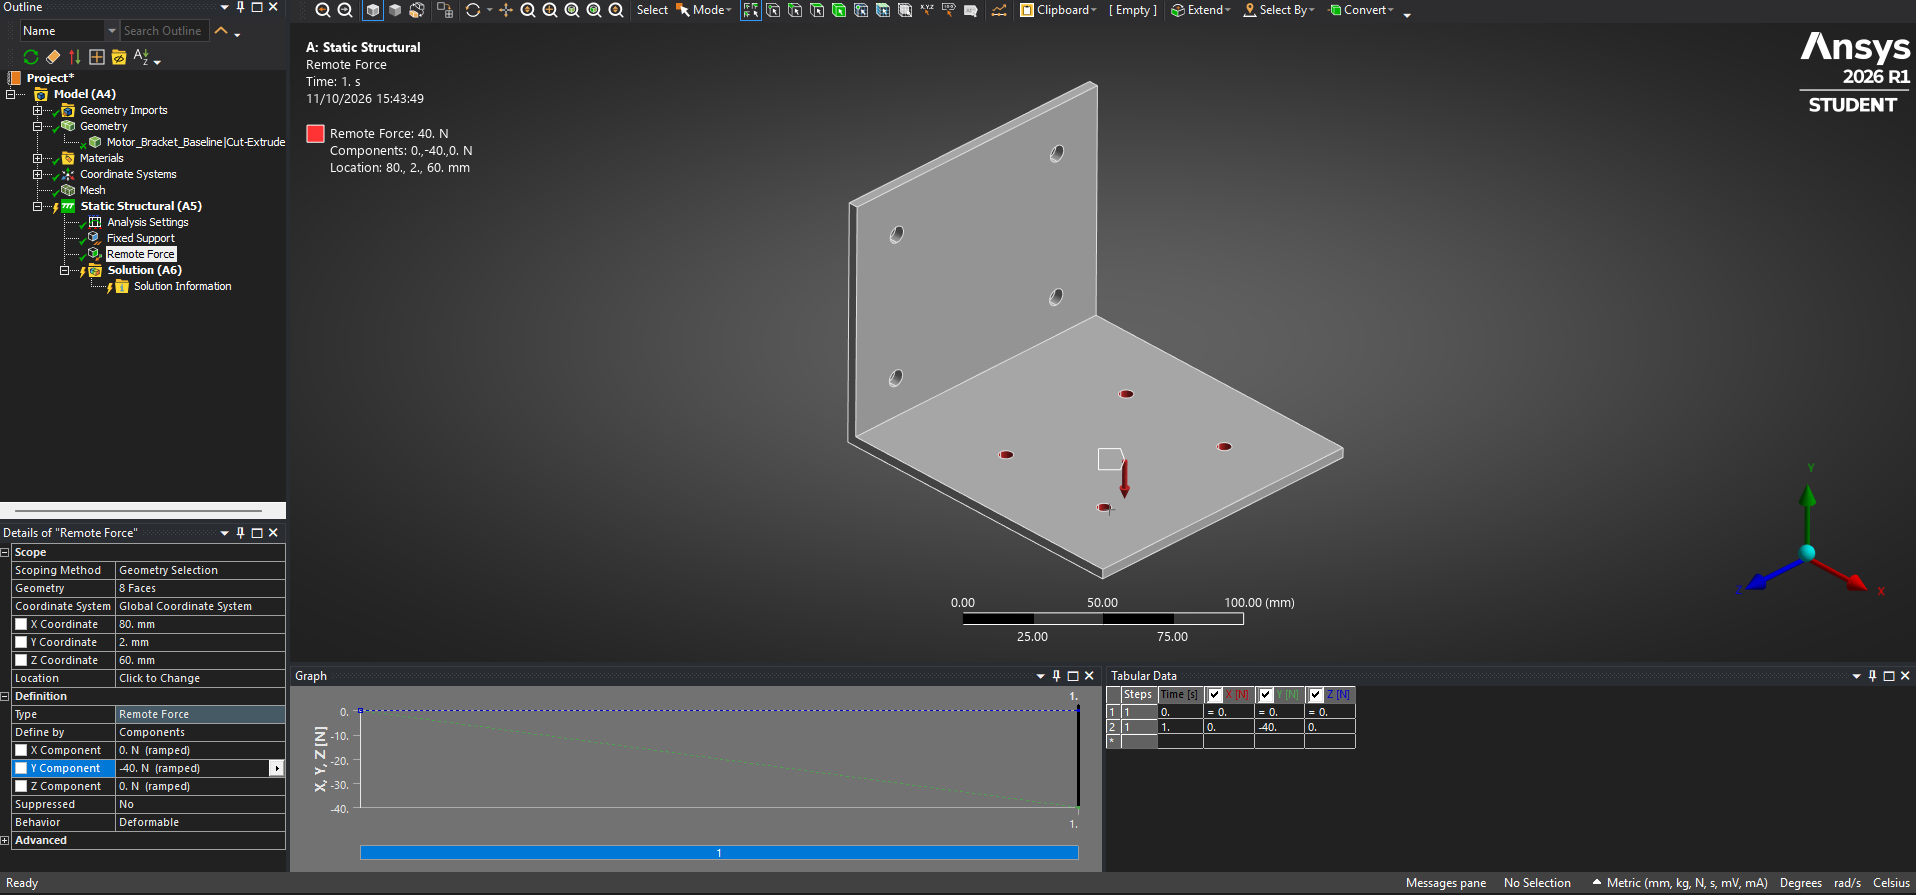
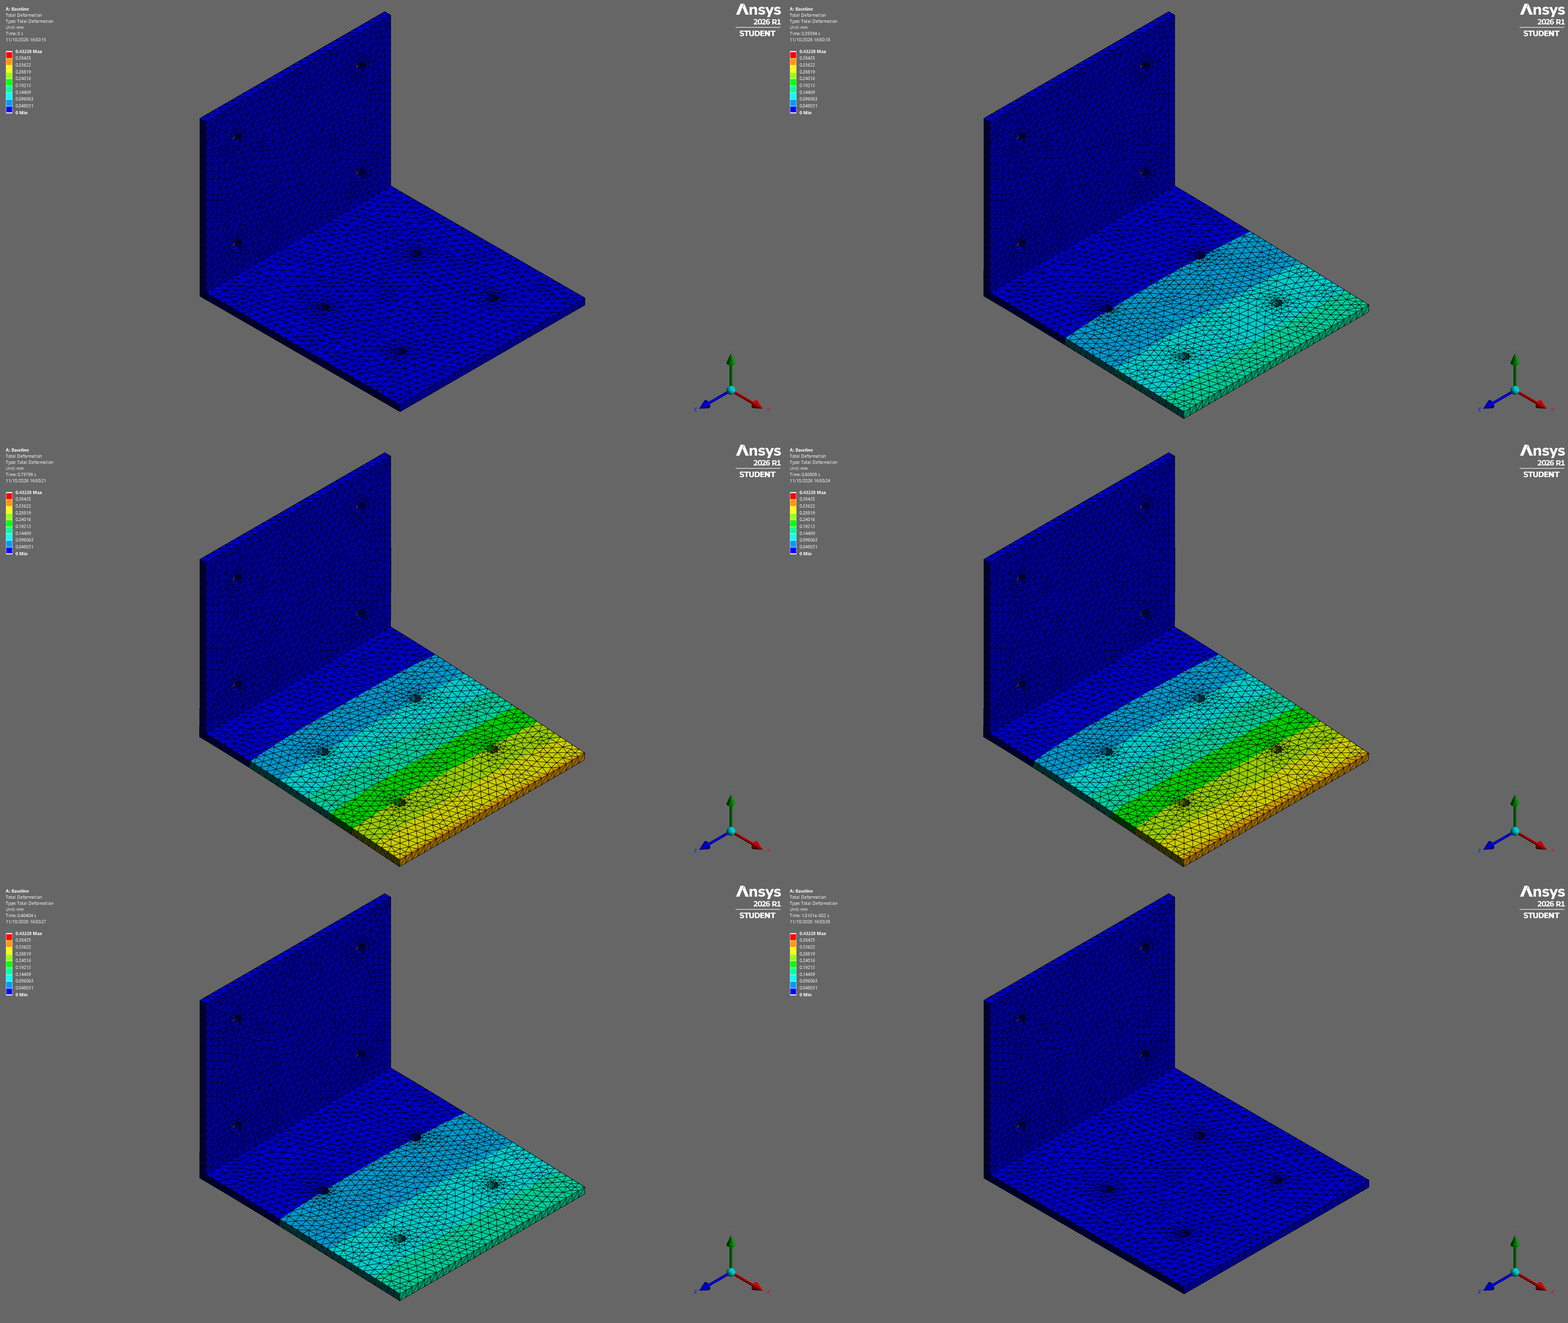
VISUAL EVIDENCE / R0 BASELINE
These recordings show the earlier unfilleted R0 baseline, not the final R10 bracket. ANSYS animates a scaled static result and load progression; this is not measured physical motion or a transient vibration simulation.
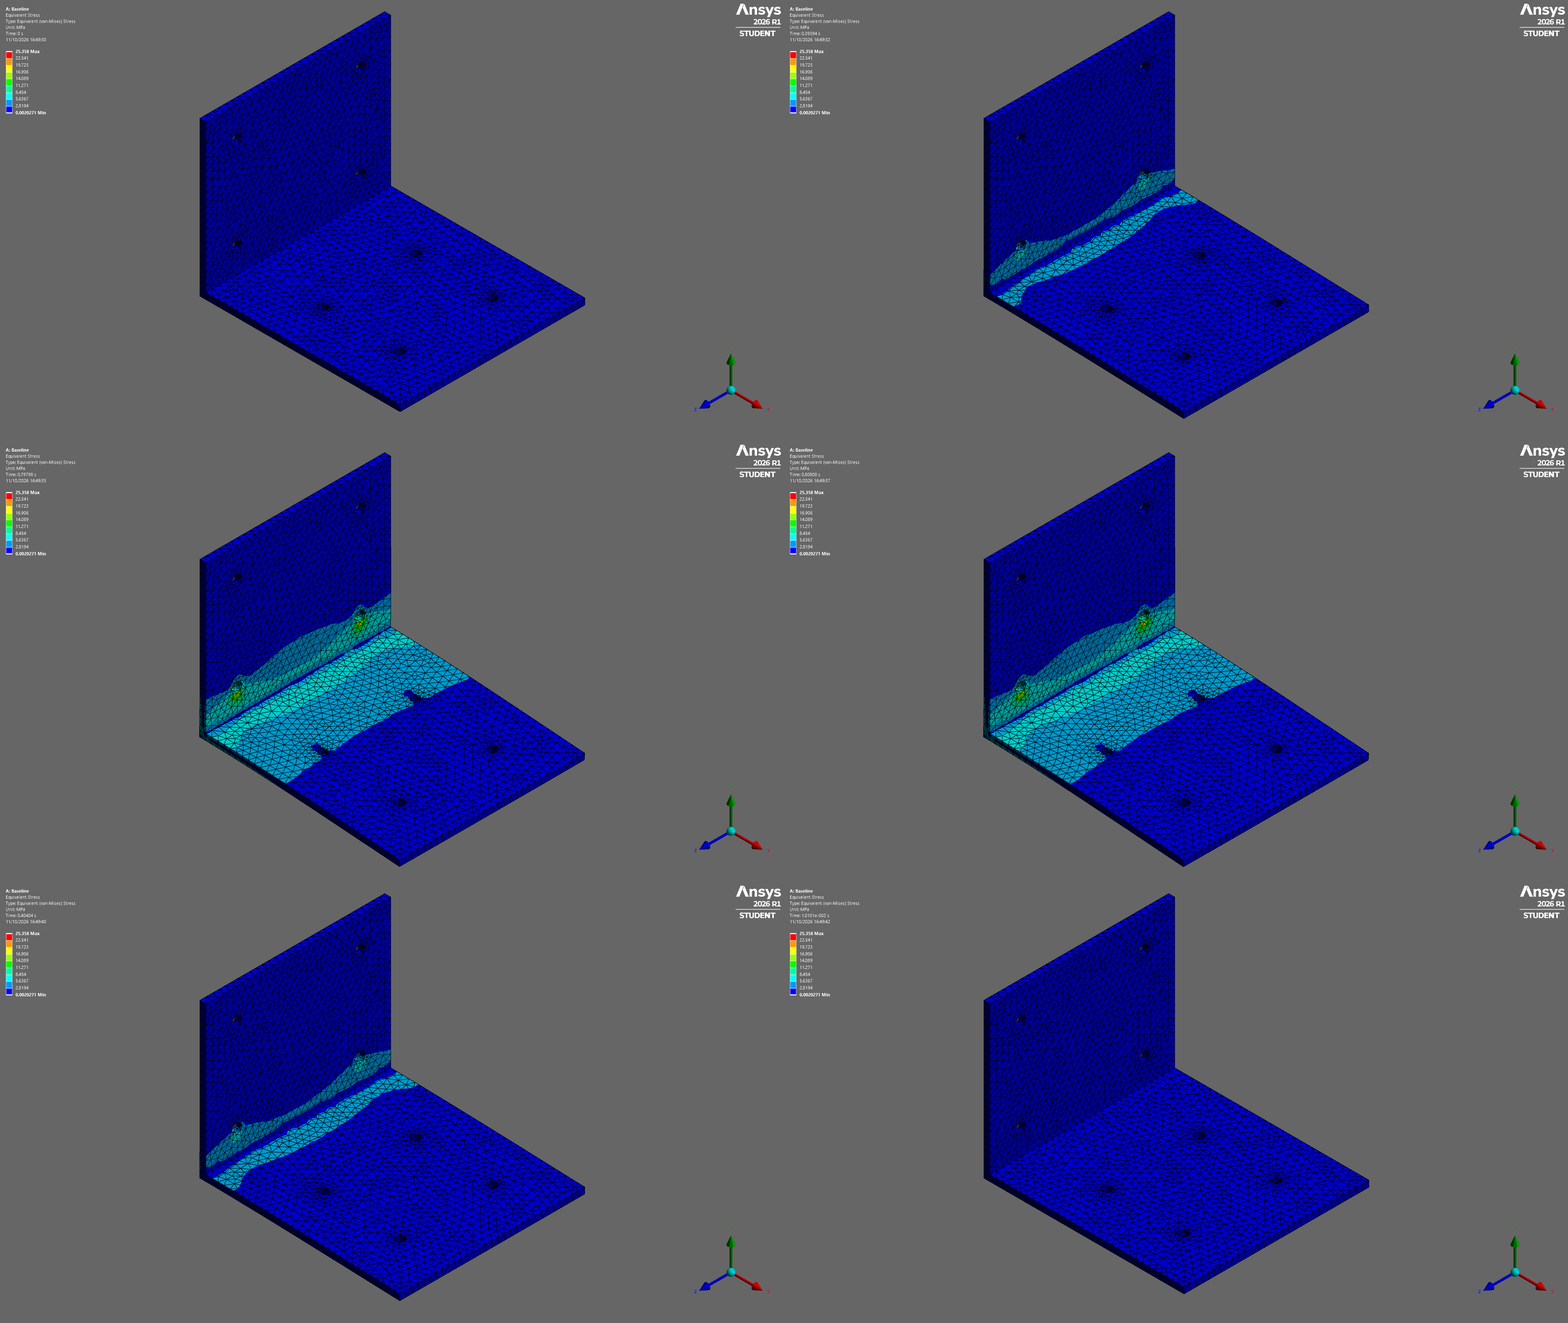
Loading basis: The 40 N test load represents a nominal 20 N motor/attachment weight multiplied by an illustrative 2g load factor. This is a study assumption, not a verified motor or acceleration specification. The 0.5 mm maximum-deflection threshold is a chosen stiffness benchmark, not a manufacturer requirement.
Modelling limitation: Fixing cylindrical hole faces is not a full bolted-joint model. The analysis does not resolve washer contact, bolt preload, joint slip, motor torque, fatigue, vibration or physical support compliance. These assumptions affect real deflection and local peak stresses.
04 / ANALYTICAL CHECK
Before the parametric study, I estimated bending stiffness using a rectangular cantilever with width 120 mm, assumed effective span 80 mm, 40 N tip load and 69 GPa Young's modulus. For a section of width b and plate thickness t, the second moments are Istrong = tb³/12 and Iweak = bt³/12. Which is called Ixx or Iyy depends on the coordinate axes; the weak axis governs vertical bending of the plate.
| Plate | Beam deflection | ANSYS R10 maximum | Beam stress | ANSYS peak stress |
|---|---|---|---|---|
| 4.0 mm | 0.15459 mm | 0.33623 mm (sweep) | 10.00 MPa | 23.337 MPa |
| 3.6 mm | 0.21206 mm | 0.46449 mm (refined) | 12.35 MPa | 29.873 MPa |
The full-bracket FEA displacement is approximately 2.2 times the simple-beam prediction at both thicknesses. The hand calculation excludes the flexible upright leg, fillet, holes and actual force transfer, and it represents idealised beam-tip displacement rather than the full model's maximum total deformation. Likewise, nominal beam stress is not directly equivalent to the local peak von Mises stress.
Interpretation: This gives an independent order-of-magnitude sanity check and confirms the expected increase in flexibility as thickness decreases. It does not validate the idealised mounting conditions or replace physical testing.
05 / PARAMETRIC OPTIMISATION
A parameter linked to both plate-thickness dimensions drove an ANSYS Workbench design-point sweep. Fifteen points were evaluated, including a duplicated 4 mm reference; there were 14 distinct thicknesses. The 3.5 mm variant narrowly failed the deflection criterion, while 3.6 mm passed.
| R10 thickness | Mass | Max deflection | Max stress | 0.5 mm test |
|---|---|---|---|---|
| 3.5 mm | 261.45 g | 0.50250 mm | 31.216 MPa | Fail |
| 3.6 mm | 268.60 g | 0.46143 mm | 29.106 MPa | Pass |
| 3.75 mm | 279.32 g | 0.40858 mm | 26.132 MPa | Pass |
| 4.0 mm | 297.15 g | 0.33623 mm | 23.337 MPa | Pass |
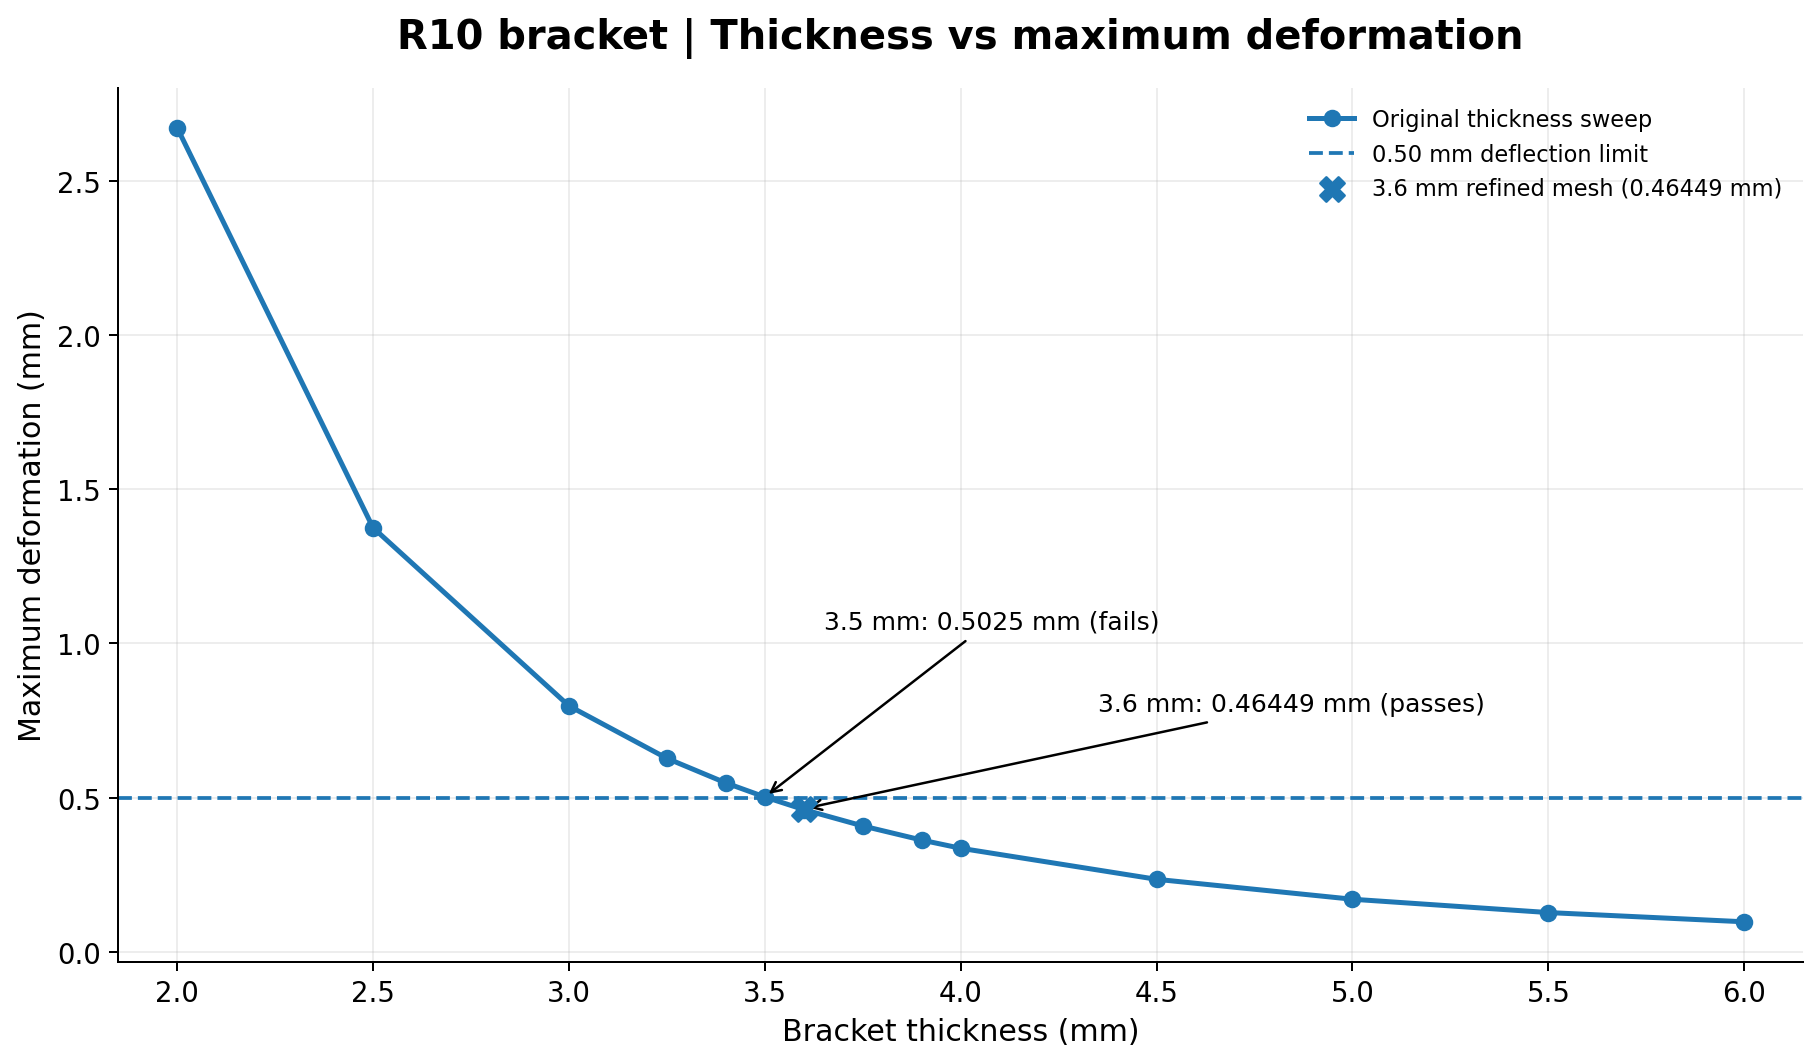
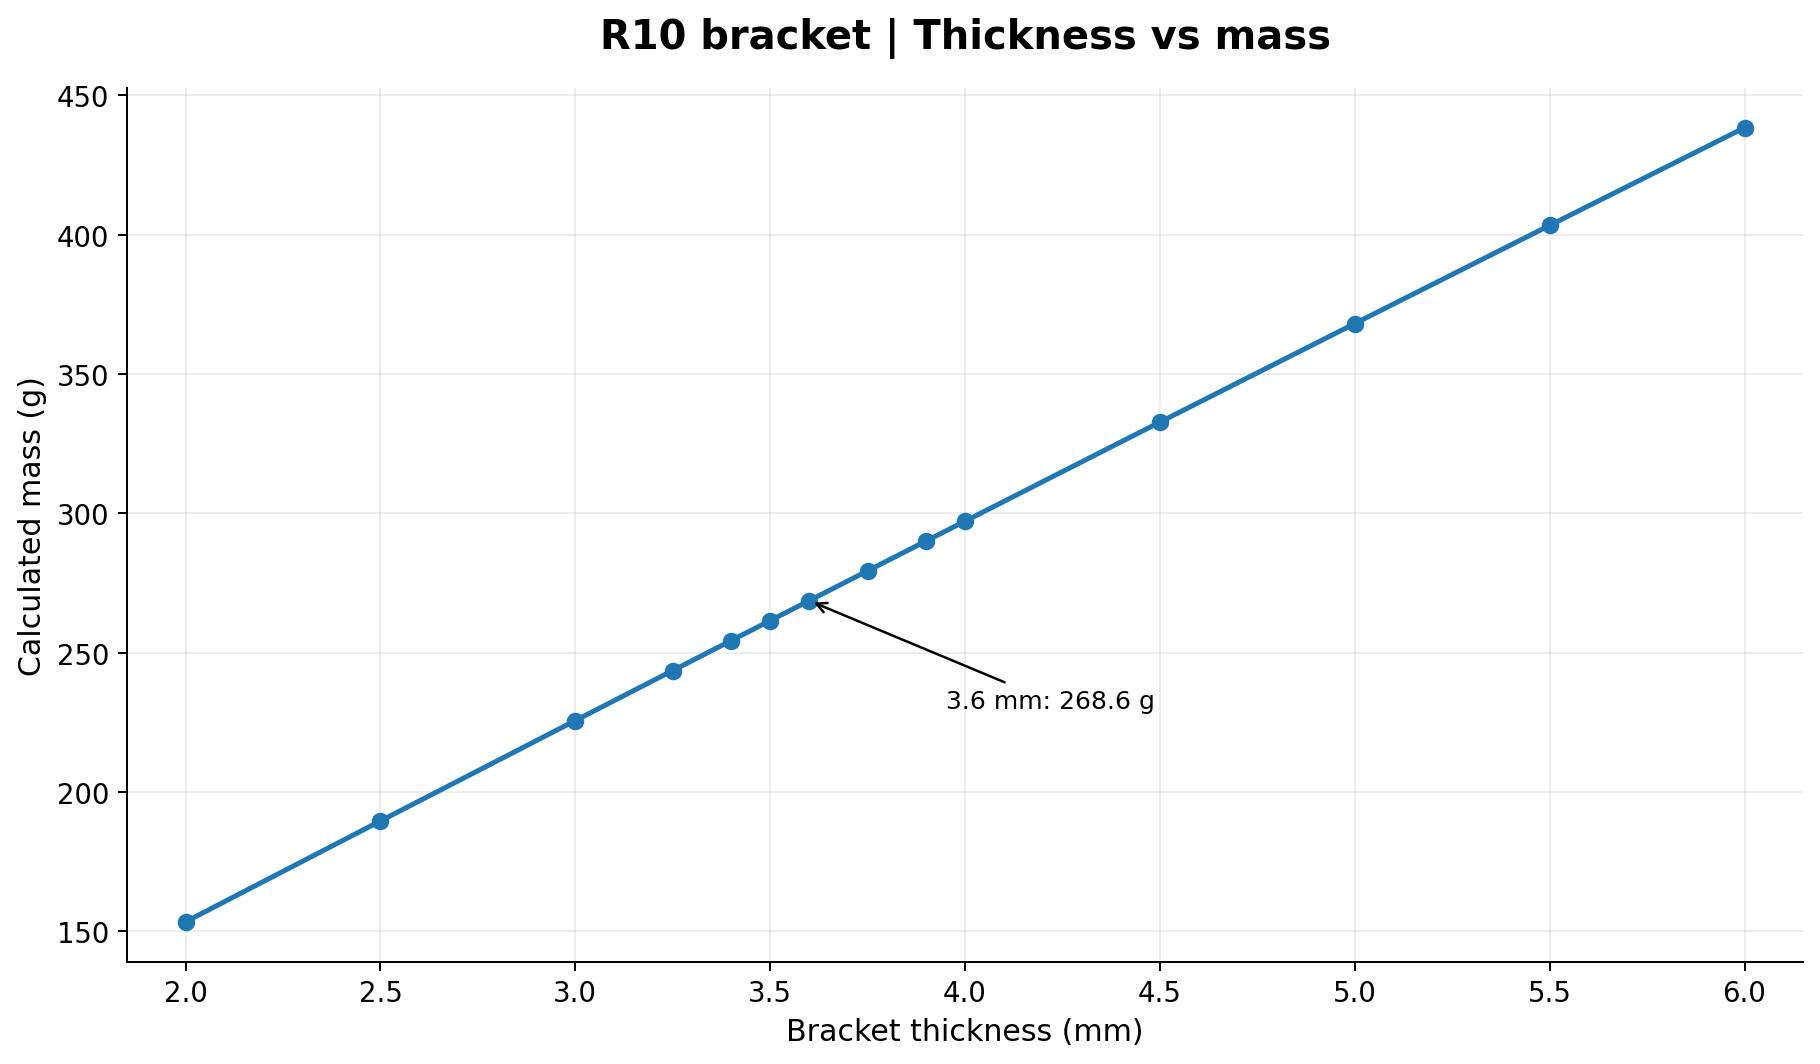
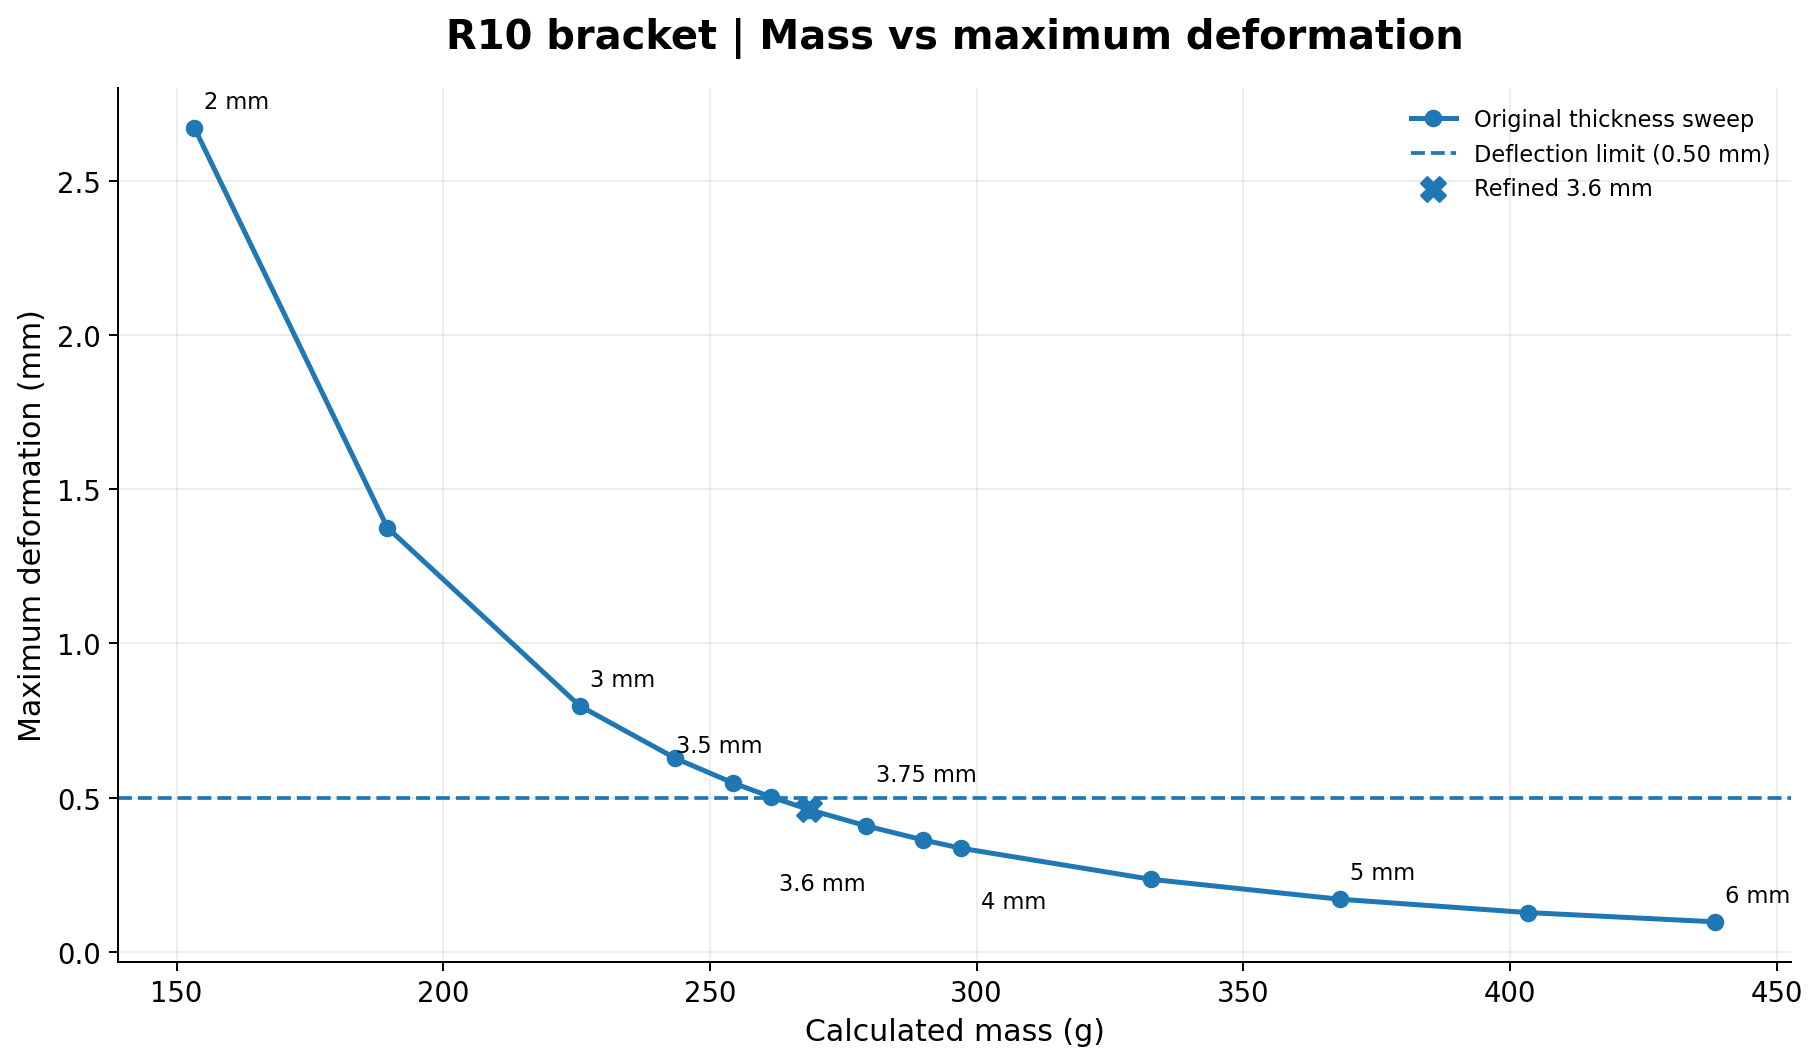
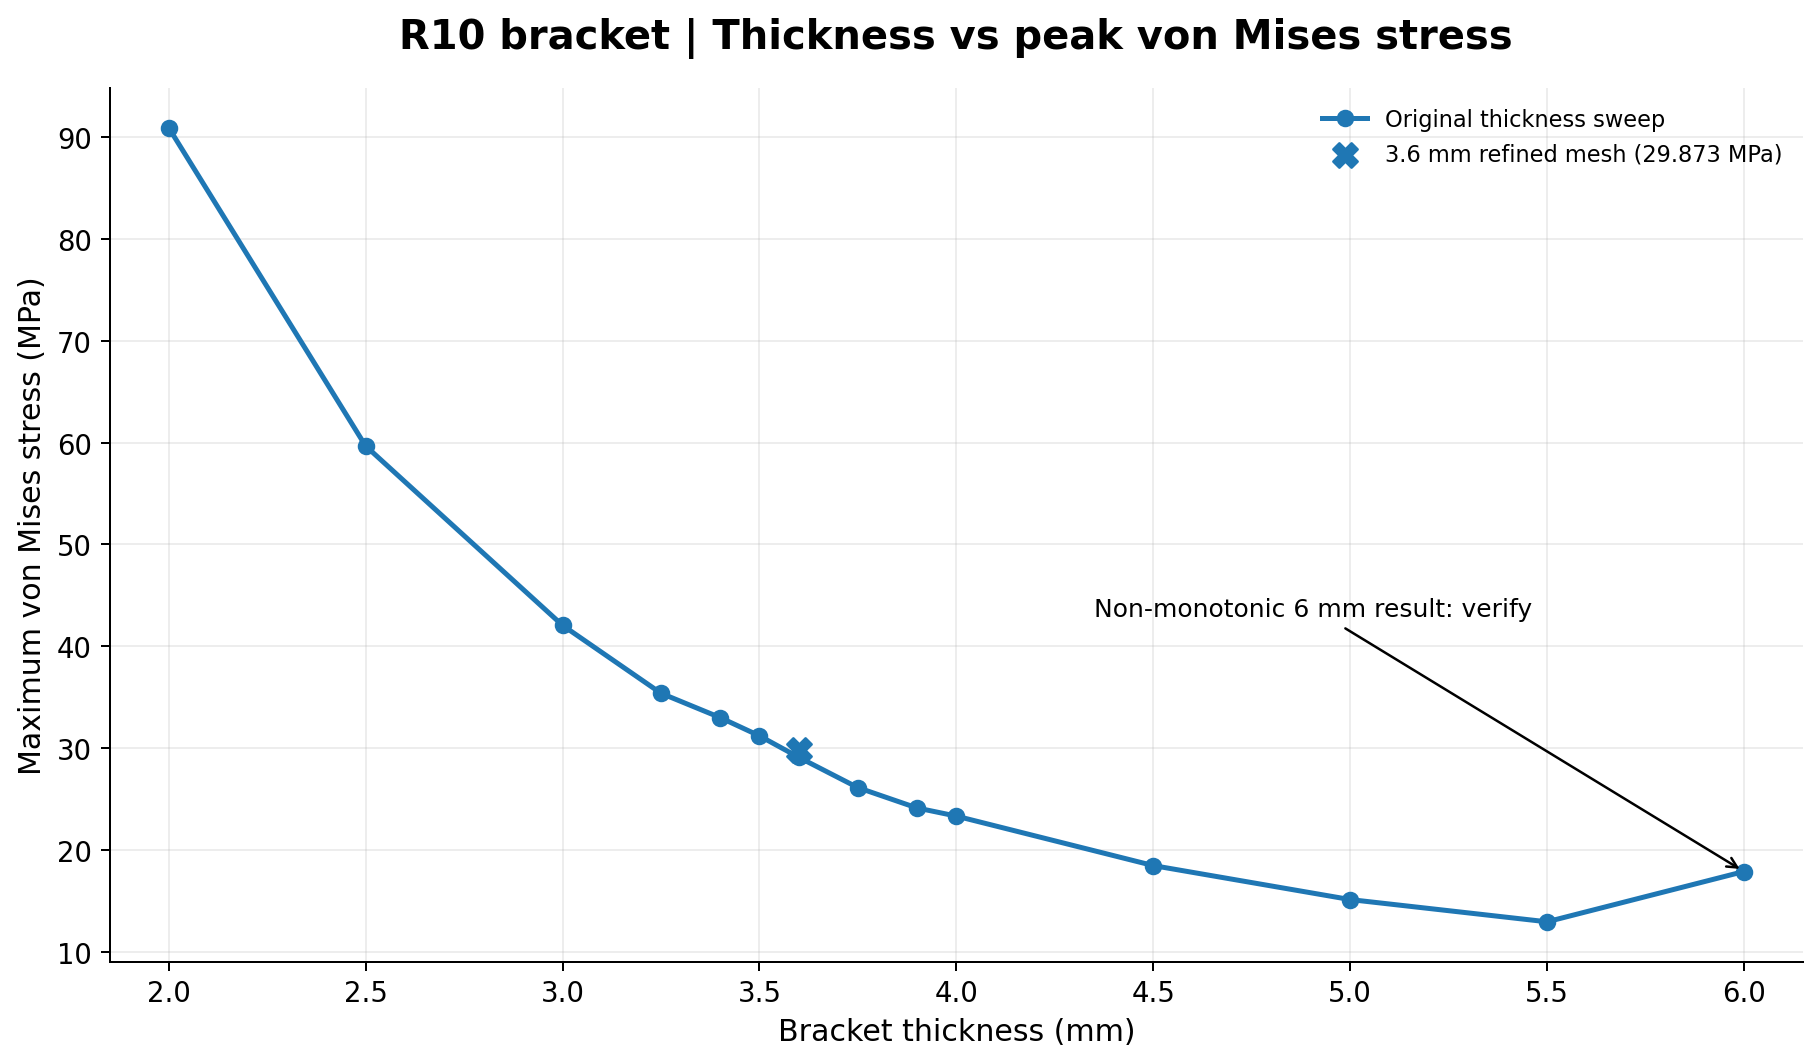
Observed anomaly: At 6 mm, reported peak stress increased relative to the 5.5 mm result. This may reflect meshing or local boundary effects and is not claimed as a verified physical trend.
06 / MESH VERIFICATION
The 3.6 mm option passes by a narrow margin. To check whether that result was dominated by mesh resolution, the model was solved with a finer global mesh and then additional local sizing on the R10 fillet. A global 2 mm mesh exceeded the Student licence's problem-size limit, so local refinement was used instead.
| Mesh | Nodes | Elements | Max deflection | Max von Mises |
|---|---|---|---|---|
| 4 mm global | Not recorded | Not recorded | 0.46143 mm | 29.106 MPa |
| 3 mm global | 62,435 | 36,306 | 0.46391 mm | 30.226 MPa |
| 3 mm global + 2 mm fillet | 69,652 | 41,018 | 0.46449 mm | 29.873 MPa |
Between the two finer solutions, maximum displacement changed by approximately 0.13%, supporting convergence of the displacement metric for these mesh settings. Peak stress changed by approximately -1.17%, but local stresses near fixed hole faces have not been fully converged.
FINAL REFINED OUTPUT / R10
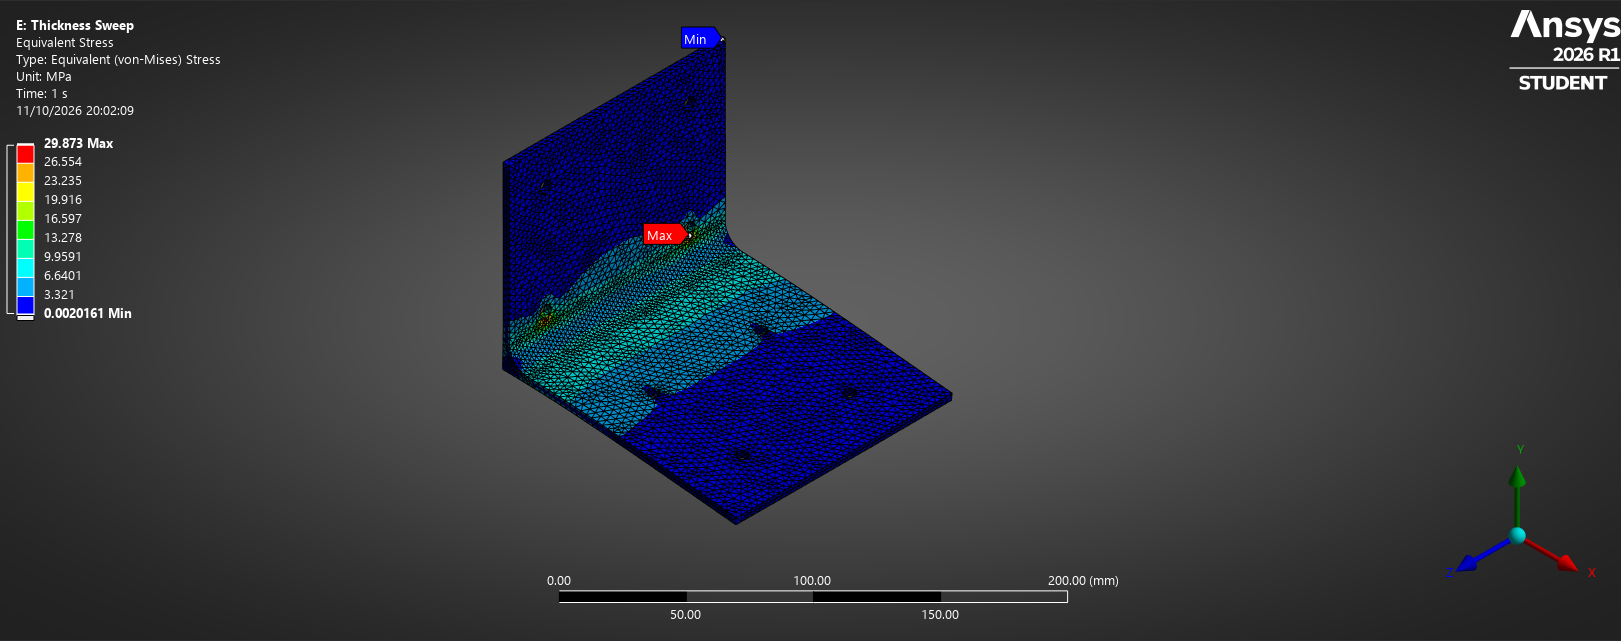
Critical distinction: Mesh convergence assesses numerical sensitivity. It does not demonstrate that the chosen bolt constraints, static force or material data reproduce a physical installation.
07 / ENGINEERING DECISION
268.60 g, refined deflection 0.46449 mm. A 9.61% mass reduction relative to the 4 mm R10 model, with roughly 7.1% clearance to the specified displacement limit.
The original sweep predicts 0.40858 mm deflection at 279.32 g, but this option has not been subjected to the same mesh refinement.
Standard material availability, forming radius, tolerances and attachment stiffness may justify using a heavier nominal plate rather than the lowest simulated thickness.
The refined stress gives a nominal 275/29.873 ≈ 9.2 material-yield ratio, not a validated assembly-level factor of safety. Deflection is the governing project criterion.
Next steps: More realistic joint constraints, motor torque and vibration cases, peak-stress investigation, manufacturing feasibility and experimental displacement measurements. The project does not claim those tests have been completed.